Flood risk map user guide
You can use our flood risk map to view various datasets that will give details of:
- flood risk
- flood defences
- shoreline management plan polices
- where flood warnings and alerts are issued
This is a guide to explain how to use the map and datasets and to provide some helpful hints to access information you need.
1 Guide to using the flood risk map
1.1 Accessing the map
When a user accesses the flood risk map they are presented with a landing page that has the map embedded into it.
Diagram 1 – Landing page for Flood risk map
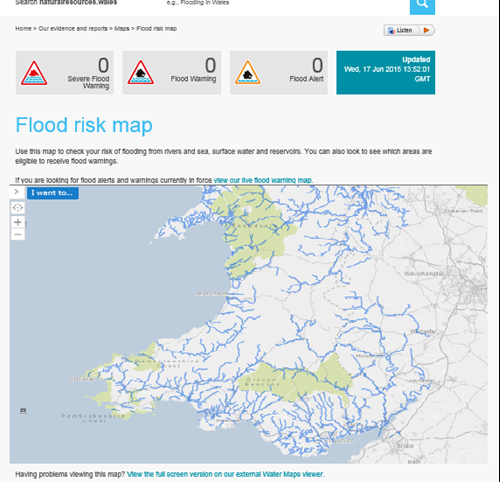
A map of Wales will be presented, which also shows the main rivers as a default. At this stage no tools are datasets are available to use. How to access the tools and manoeuvre around the map will be described in the following sections.
1.2 Tools and functions of the map
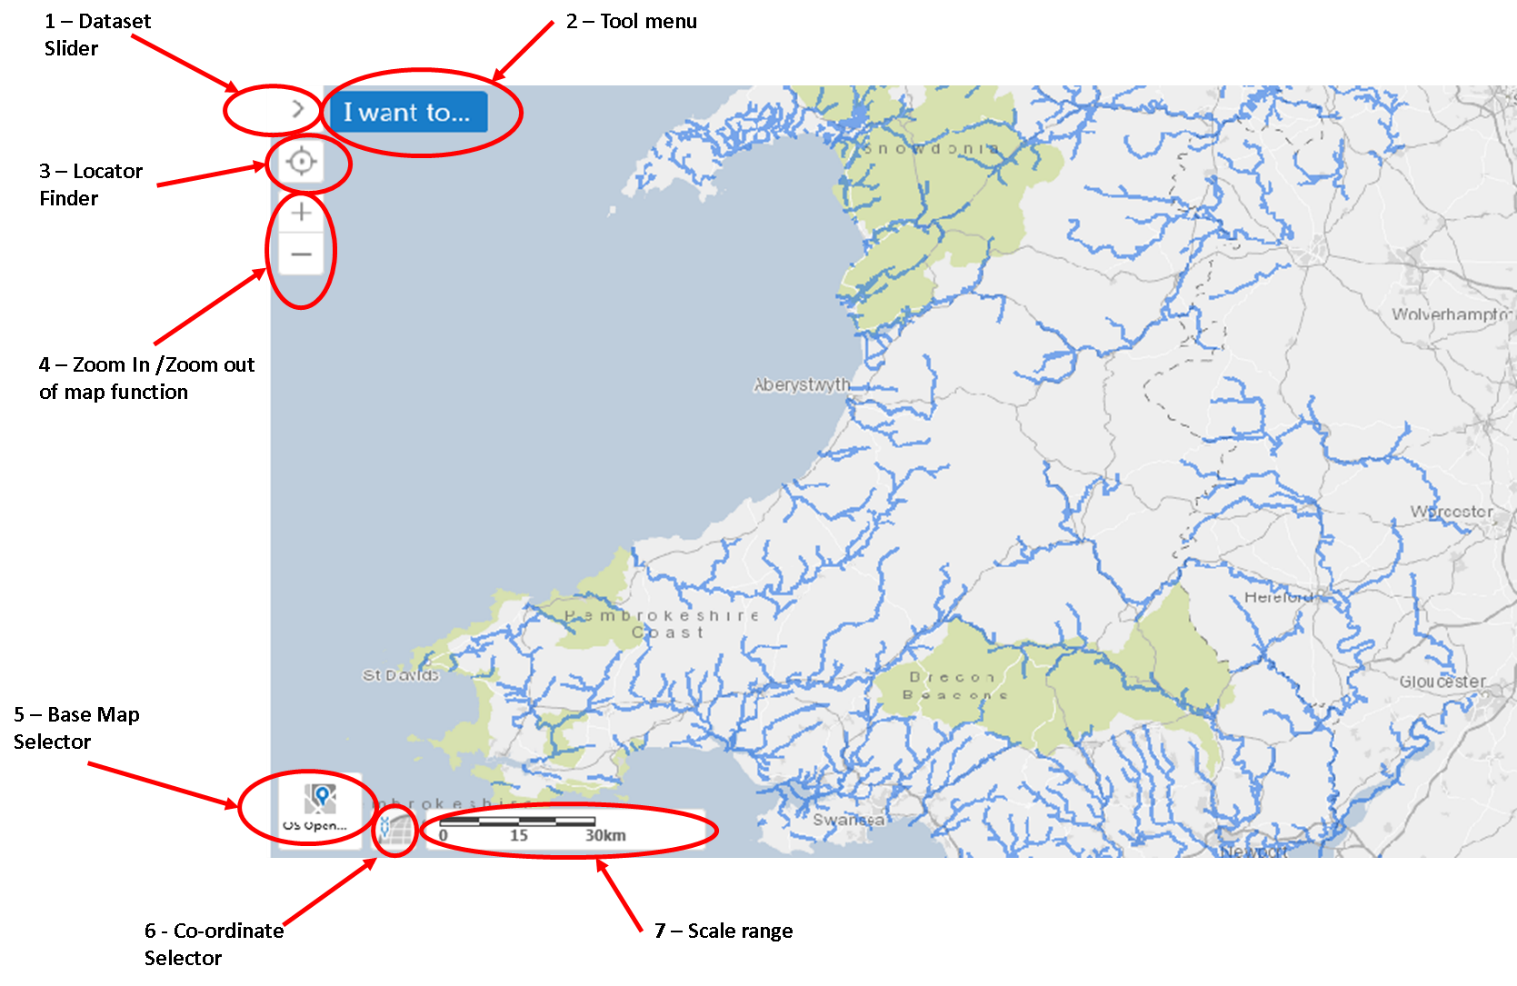
The following is a labelled diagram of the main tools and functions within the map:
Diagram 2 – labelled diagram of main tools
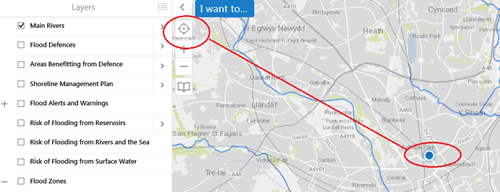
1.2.1 Dataset Slider
Clicking on the symbol > opens the dataset slider and reveal the datasets available within the map, as shown below:
Diagram 3 – Dataset slider
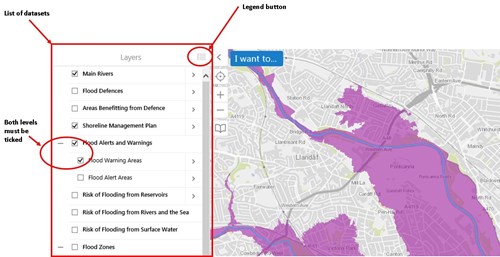
Each of the datasets display either a polygon, line or point of the area they relate to. Simply tick the relevant dataset required and a polygon, line or point will appear on the map. Note you will need to zoom in to a certain level (1:300,000) to see the shapes.
The map is able to display one or multiple datasets at the same time. Each of the datasets are displayed on the map in different colours. Use the legend button (as shown on the diagram) to determine which colour relates to which dataset.
Some datasets have a + or - sign next to it. This is because there are multiple datasets sitting within them that can be exposed or hidden using the + or - sign. Note that the higher level and the lower level datasets need to be ticked before they are viewable on the map, as displayed in the diagram above.
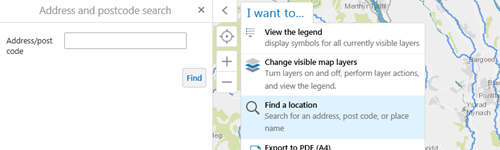
1.2.2 Tool Menu (I want to….)
The ‘I want to….’ function presents a number of pre-determined tools and actions for a user to select. These are:
- View the legend
- Change visible map layers
- Find a location
- Export to PDF (A4)
- Export to PDF (A3)
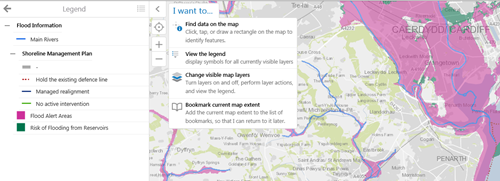
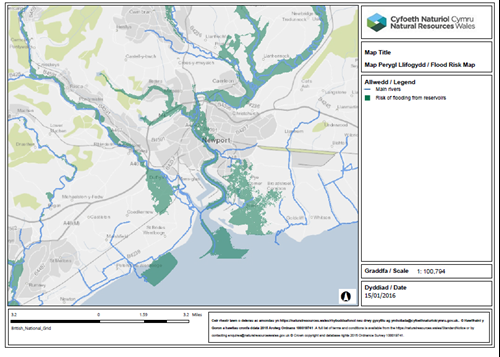
1.2.2.1 I want to…View the legend
This function shows the legend for the datasets that have been selected and the colours of the polygons or the types of line displayed on the map. An example of the legend result is as follows:
Diagram 4 – viewing legend
1.2.2.2 I want to…Change visible map layers
This is a quick function to return to the dataset screen that displays the list of datasets.
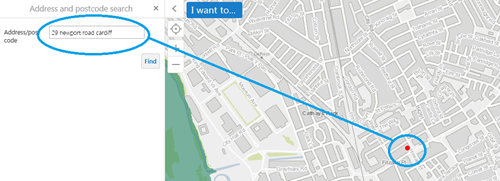
1.2.2.3 I want to…Find a location
This allows the user to enter a place name, street name or postcode and zoom to that point on a map. Selecting this option pops up a search box on the left hand side of the screen as follows:
Diagram 5 – location on the map
This allows the user to enter an exact address eg 29 Newport road Cardiff, which will zoom to the address and add a red dot to show where it is in the map:
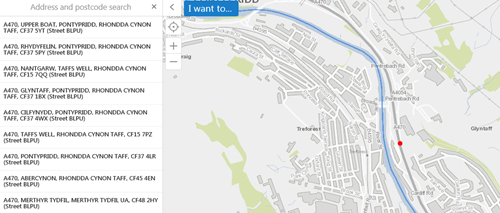
If the postcode is entered the user is presented with a list of addresses to choose from, as follows:
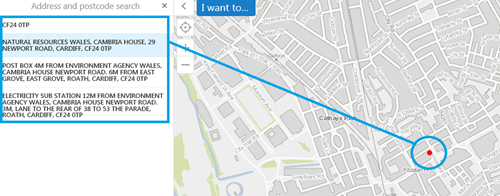
Simply click on the address and press ‘Select’ and it will zoom to the address and add a red dot to show where it is in the map.
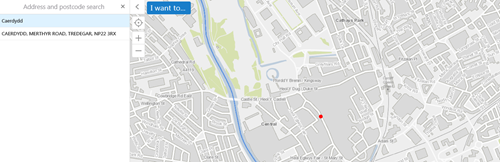
If the place name is entered eg Cardiff (or Caerdydd), then the map will zoom to the centre point of the place. The place name can be entered in English or Welsh.
Finally, a search can be made against road names eg A470 or the B4239. By entering the road name the user will be presented with a number of points along the road and will be able to select the most relevant to them, which will zoom the screen to the point on the map.
Once the relevant point has been selected, the user will have full use of the other features within the viewer and be able to turn on or off any of the layers.
1.2.2.4 I want to…Export to PDF (A4) or Export to PDF (A3)
This allows the current screen to be exported into a print template that is either A4 paper size or A3 paper size. This can be saved locally or printed by the user.
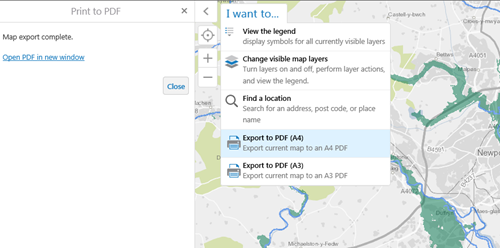
Selecting this function creates a link to a pdf version of the screen called Open PDF in new window, which opens a new browser and places the screenshot into the following print template:
It is recommended that you open the full viewer before the PDF is generated.
1.2.3 Locator Finder
Clicking the locator finder will identify the current location of the device being used and place a point on the map for that location. This will work on any desktop, tablet or mobile device (mobile devices may require the ‘navigation’ feature to be turned on).
Diagram 5 – location on the map
1.2.4 Zoom in / Zoom out feature
This is a tool to allow the user to change the scale view of the map and see features at a closer or higher level.
1.2.5 Base Map Feature
The base maps are provided by Ordinance Survey (OS) and there are 3 base maps to choose from, each providing a different view and perspective. The 3 base maps are:
- OS open background
- OS carto
- OS premium rasters
A default map (OS open background) will always appear but the other available base maps can be selected using this feature.
1.2.6 Co-ordinate selector
The default co-ordinate for the map is latitude/longitude (Lat/Long). This can be changed to x/y if this is preferred using this tool.
1.2.7 Scale range
The scale range is to be used to measure distances on the map. The range increases/decreases in line with the zoom in/zoom out feature.